


Next: Homological Analysis
Up: Analysis and Interpretation
Previous: Structure and occurrence of
Contents
As the basic structure of specific SR and SR-related proteins was presented, one can align the protein sequences of one RS protein family in one species against the same family in other species. Afterwards an alignment of all SR proteins in human against each other was done.
The results - the N-J-trees taken from t_coffee - were as following:
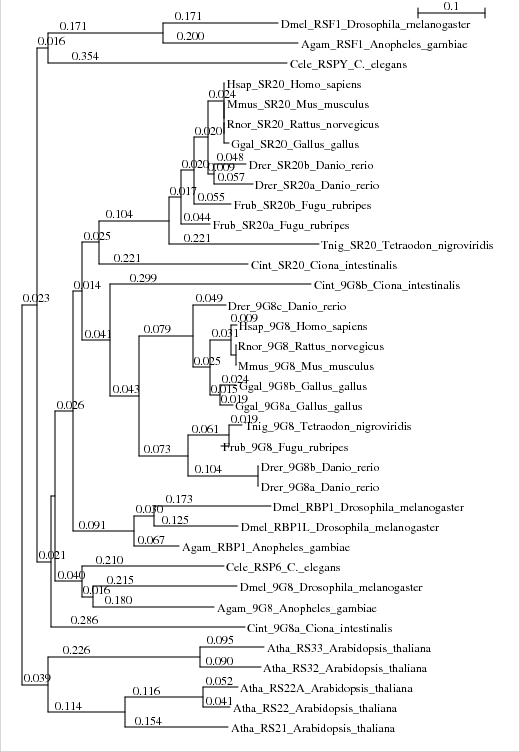
- SRp20 9G8:
As one can see, the evolution of SRp20 9G8 pretty much followed the evolution of species with one remarkably fact: SRp20 and 9G8 have seperated early in the evolution (it's not very likely that so many species co-evolved both of them equally).
Figure 4:
9G8-SRp20 homology
|
|
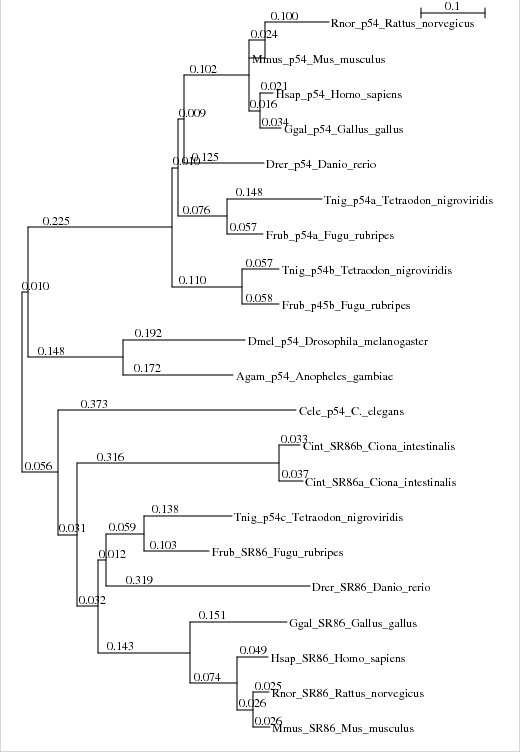
- p54 SRp86:
Again there is a distinct seperation of p54 and SRp86 in the species (visible especially in human and rattus norvegicus), but the p54-annotated SR proteins for Caenorhabditis elegans (C. elegans) and Tetraodon nigroviridis may have been falsely annotated or (which may be more likely) are historical names. As the alignment shows they may fit better as SRp86, but this needs further research which is out of scope of this internship.
Figure 5:
p54 SRp86 homology
|
|
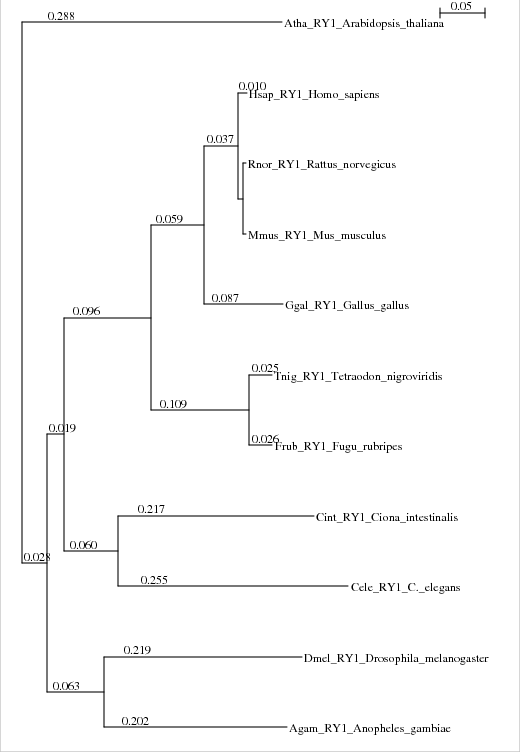
- RY1:
The results show that the Nematoda (C. elegans) seem to be nearer to Chordata than Insecta (Drosophila melanogaster) which may indicate that there was a parallel evolution in both groups, but this theory needs further research to confirm or refuse.
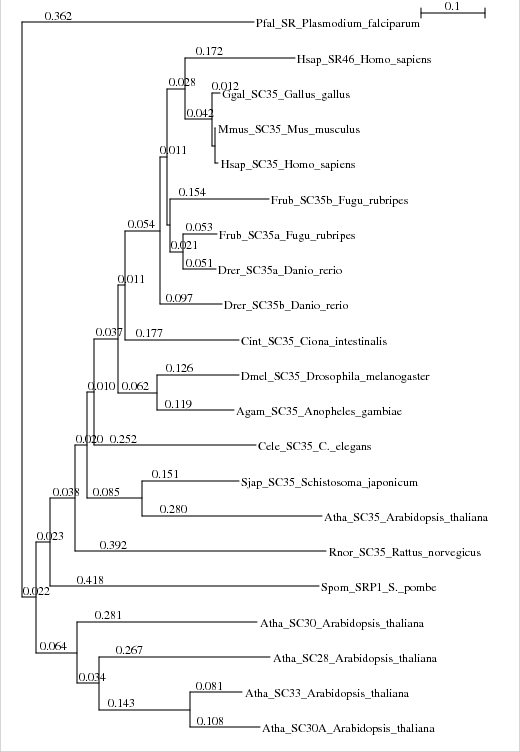
- SC35:
Nothing surprising here, except that the subgroups of SC35 (SC35a/b, SR46) differ with the exception of SC35 in Fugu in between many SC35a. In contrast, the SC35 of Danio Rerio seems to differ much more (same with human SR46/SC35).
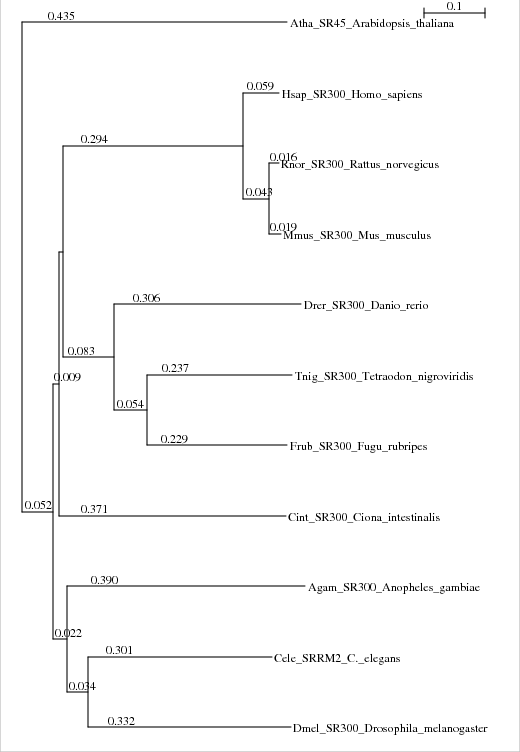
- SRm300:
There is a long branch length indicating that SRm300 may evolve very fast, which is not surprising in regard to the structure. The length a (possibly highly-conserved) RS domain is rather short compared to the rest of the protein.
Figure 8:
SRm300 homology
|
|
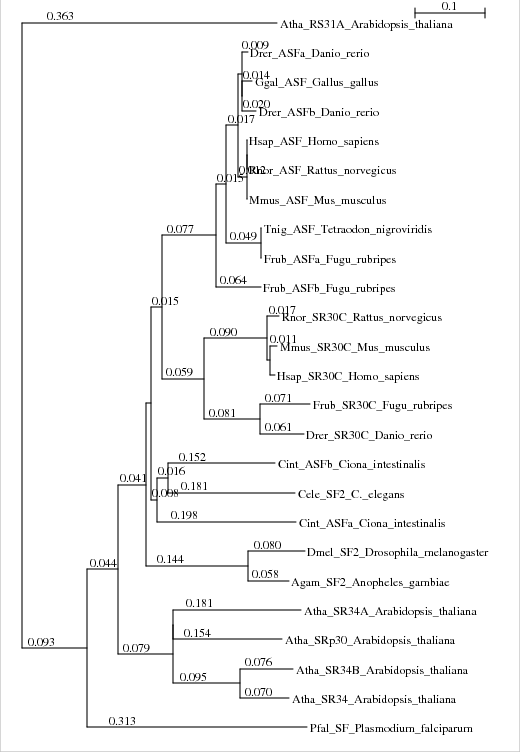
- SRp30c-ASF:
The very short branch length may indicate that the evolution of SRp30c-ASF is progressing very slow. There is visible evidence that during evolution multiple types of ASF proteins may have seperated from each other - especially when comparing chordata with the other phyla.
Figure 9:
SRp30c-ASF homology
|
|
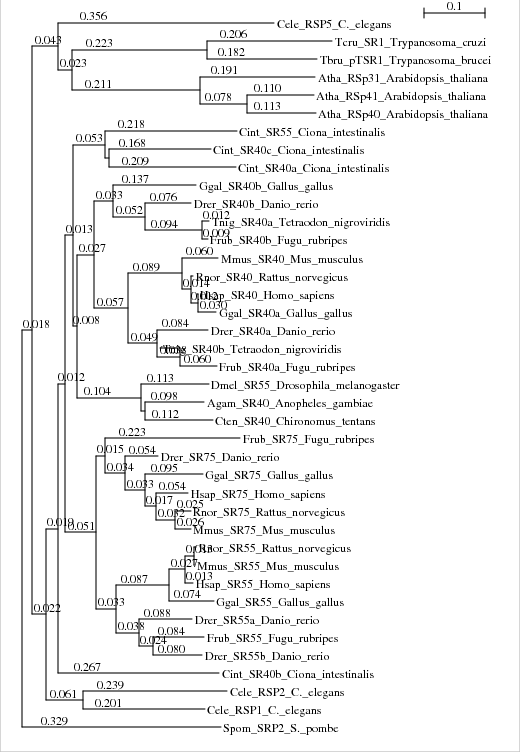
- SRp40-55-75:
Again there are signs that indicate an seperation of chordata from other phyla early in the evolution. It is noteworthy that SR-55 and SR-75 are more related based on the given data (but are only expressed in chordata). The same applies for SR-40a and R-40b.
Figure 10:
SRp40-55-75 homology
|
|
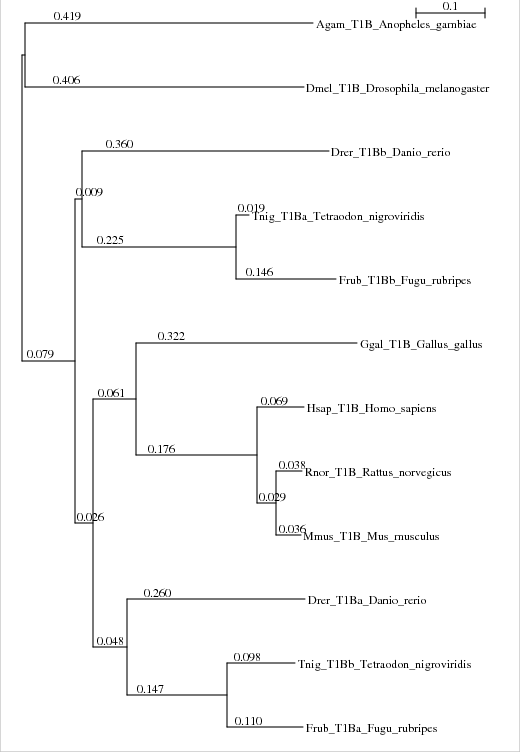
- TopoI-B:
It seems that in Tetraodon nigroviridis, T1Ba and T1Bb are confused with each other, otherwise there is no significant information other than the fact that the evolution of T1B may have followed the evolution of species after splitting to T1Ba and T1Bb somewhere in chordata.
Figure 11:
TopoI-B homology
|
|
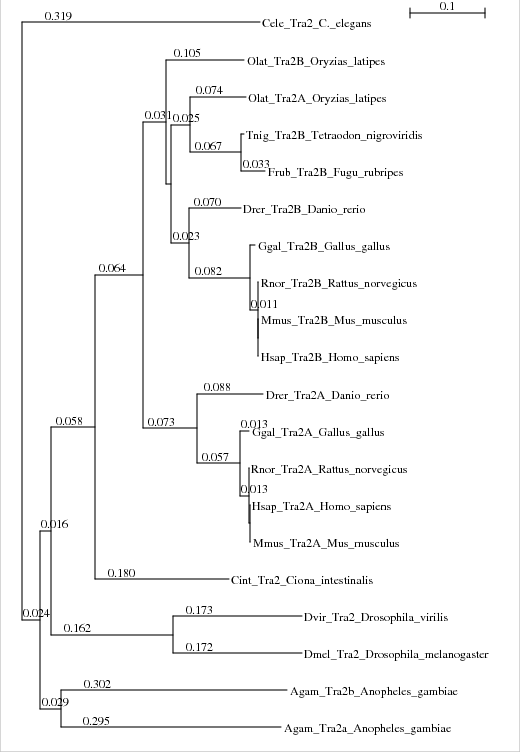
- Tra2:
There is a nice splitting between Tra2A and Tra2B visible allthough the data for Oryzias latipes (and all other Actinopterygii) may indicate that their Tra2A evolved parallel to Tra2A of other higher chordata.
- Comparison of all SR proteins in human:
This view shows the homologs for each SR protein in human. This is meant to summarize the other gene files as the shows the groups of SR proteins more clearly.
Figure 13:
Comparison of all SR proteins in human
|
|
Next: Homological Analysis
Up: Analysis and Interpretation
Previous: Structure and occurrence of
Contents
Rene Ploetz
2009-06-05
![\includegraphics[height=200pt]{9G8-SRp20.epsi}](img4.png)
![\includegraphics[height=200pt]{p54.epsi}](img5.png)
![\includegraphics[height=200pt]{RY1.epsi}](img6.png)
![\includegraphics[height=200pt]{SC35.epsi}](img7.png)
![\includegraphics[height=200pt]{SRm300.epsi}](img8.png)
![\includegraphics[height=200pt]{SRp30c-ASF.epsi}](img9.png)
![\includegraphics[height=200pt]{SRp40-55-75.epsi}](img10.png)
![\includegraphics[height=200pt]{TopoI-B.epsi}](img11.png)
![\includegraphics[height=200pt]{Tra2.epsi}](img12.png)
![\includegraphics[height=200pt]{comp_human.epsi}](img13.png)